An evidence-led descent / Global marine fisheries
OVERFISHING
What the calm surface does not show.

Descent through overfishing evidence
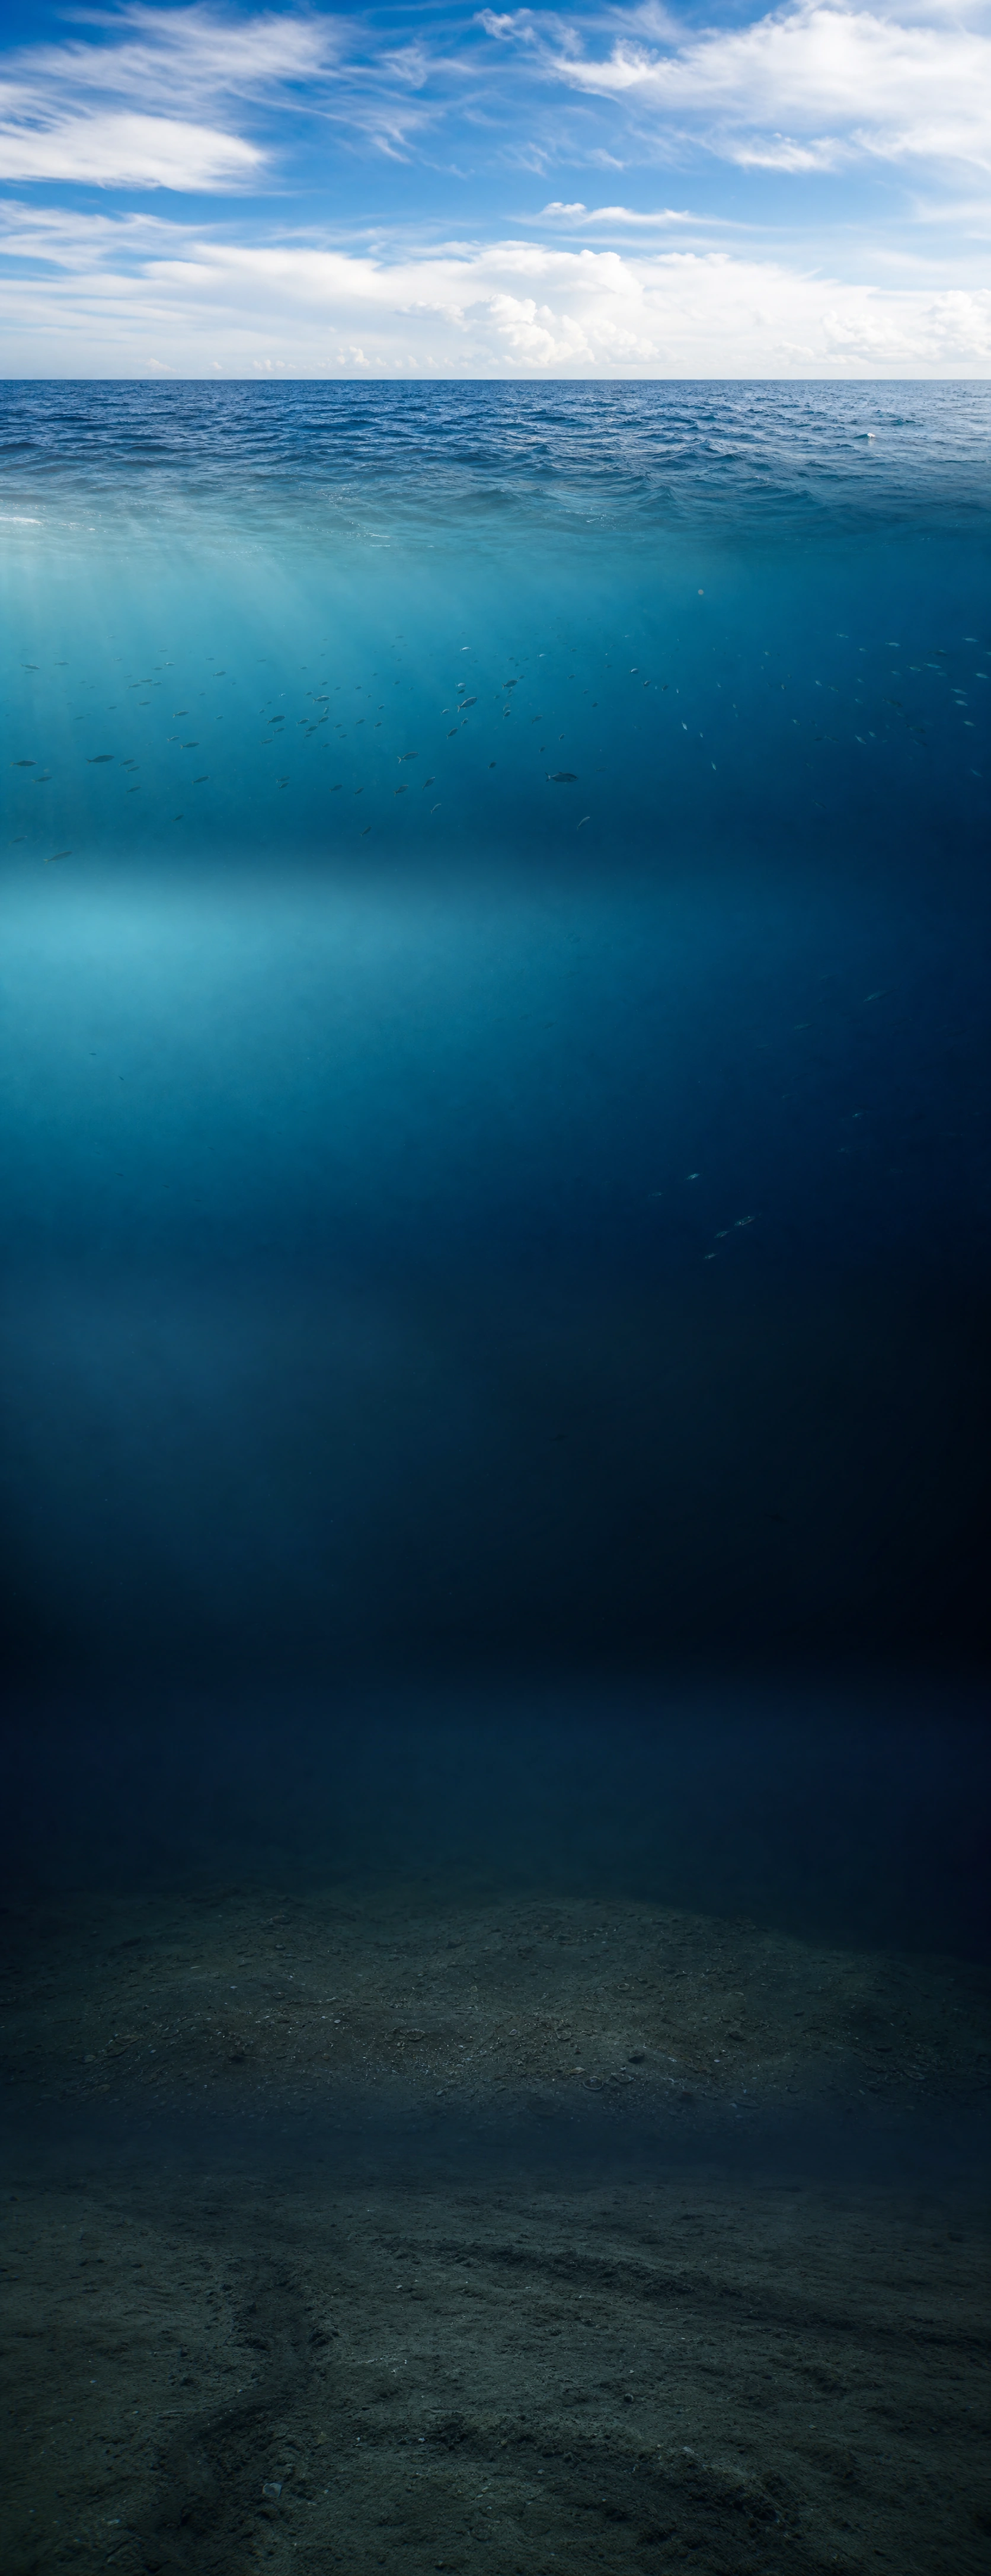
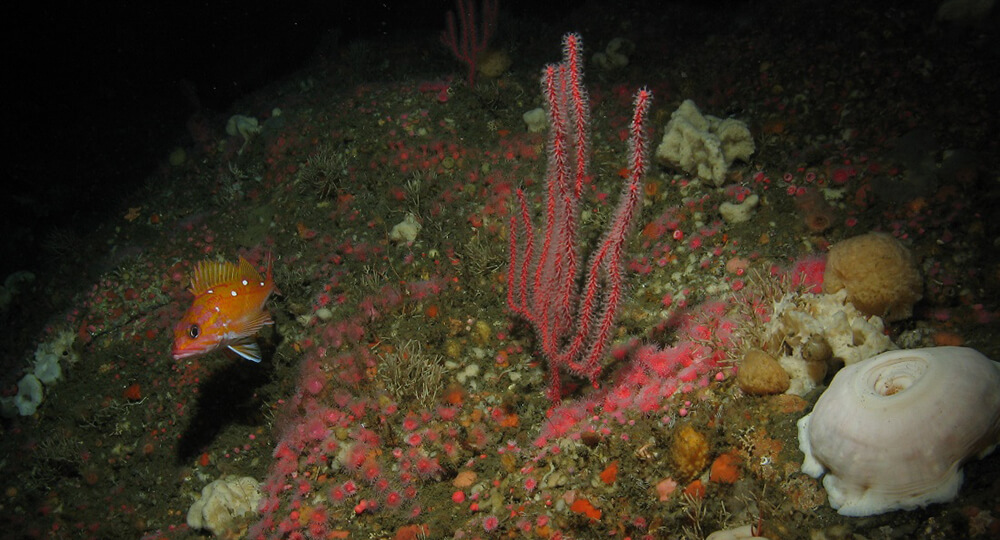
Arrival at the disturbed seabed
03 / Seabed
What left these marks?
Reverse ascent from the seabed to the ocean surface
04 / Ascent
03 / Field notes
Overfishing is not one image. It is a chain of consequences.
Documentary photography, measured data and direct source links connect fishing pressure to population decline, bycatch and habitat disturbance. Every headline figure retains its year, scope and limitation.
Global scale / FAO 2025
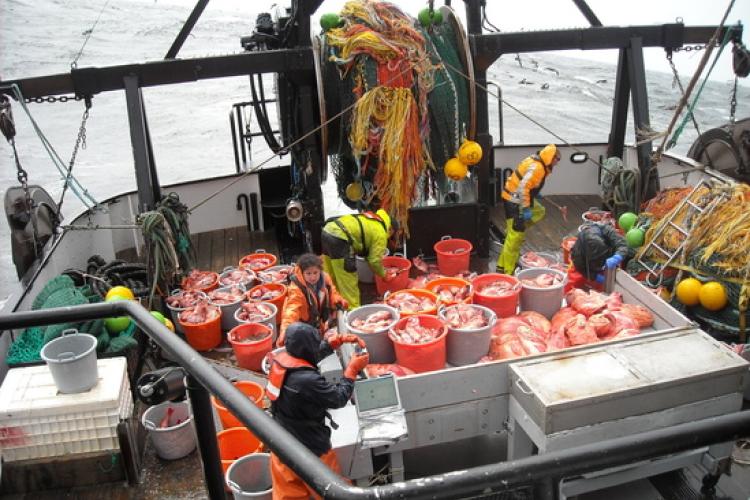
35.5% of assessed marine fish stocks are overfished.
FAO’s most detailed global assessment covers 2,570 stocks. The same report shows that strong, science-based management produces much better outcomes—decline is not inevitable.
- 2,570
- stocks assessed
- 64.5%
- biologically sustainable
- 35.5%
- overfished
Food webs / Science 1998
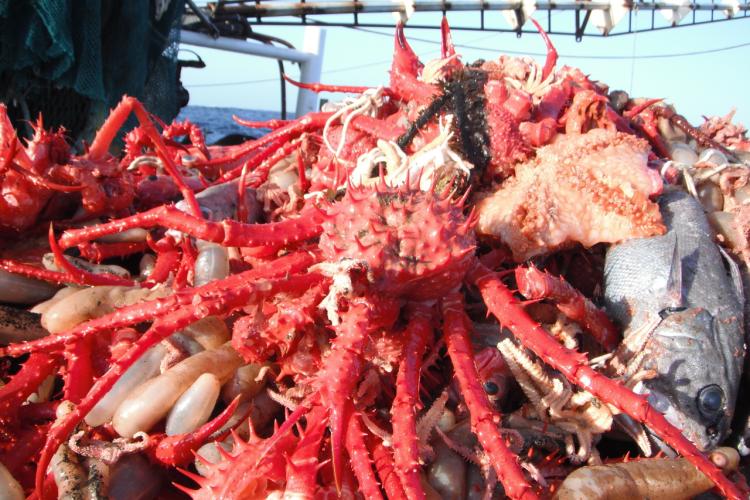
The catch can move down the food web before it disappears.
Pauly and colleagues found a decline in the mean trophic level of species groups reported in FAO landings from 1950 to 1994. Later research showed that both depletion of upper levels and the addition of lower-trophic fisheries can shape this pattern.
Landings data describe what fisheries report; they are not a complete census of every organism in the ecosystem.Pauly et al., Science, 1998 ↗
Bycatch / NOAA Fisheries
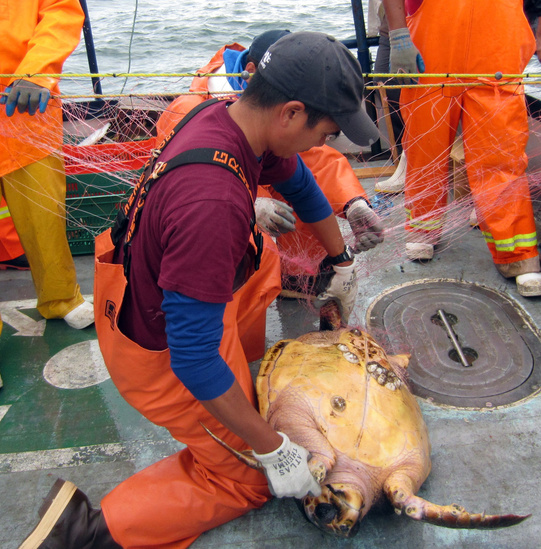
A net does not understand the word “target.”
Bycatch includes discarded catch and unobserved mortality caused by direct encounters with fishing vessels and gear. It can include fish, marine mammals, sea turtles, seabirds, corals and sponges, and can impede population recovery.
Seabed / PNAS 2018
Some extraction also changes the place recovery must happen.
Amoroso and colleagues mapped bottom-trawl footprints across 24 continental shelves and slopes. Bottom trawlers land roughly 19 million tonnes each year; 14% of the study's 7.8 million km² area was trawled, with strong regional variation.
- 19m t
- landed annually
- 14%
- of the 7.8m km² study area trawled
- 86%
- of the study area not trawled
04 / Verified briefing
What is measured before anything is simulated.
Select a lens. These figures come from institutional publications or peer-reviewed research; the interactive experiment that follows uses illustrative indices rather than a real stock forecast.
Biological threshold / NOAA + FAO
A rate can be too high before a population looks empty.
NOAA distinguishes overfishing, an excessive harvest rate, from overfished, a population whose size is already too low. FAO's 2025 assessment classified 35.5% of 2,570 assessed marine fish stocks as overfished.
Industrial footprint / Science 2018
Fishing activity can be observed across an ocean.
Kroodsma and colleagues processed 22 billion AIS messages and tracked more than 70,000 industrial fishing vessels from 2012 to 2016. At the study's grid resolution, observed activity occurred in more than 55% of ocean area.
Kroodsma et al., Science, 2018 ↗The human ocean / FAO + UK official statistics
Fishing is an ecological system and a human livelihood.
Small-scale fisheries account for at least 40% of global capture-fisheries catch and provide work across the value chain for an estimated 60.2 million people. In 2024, UK vessels landed 745 thousand tonnes of sea fish valued at £1.16 billion.
Recovery / Nature Sustainability 2021
Decline is not inevitable, but recovery is designed.
A global study of 288 assessed fisheries found that rebuilding plans, international agreements and harvest control rules helped reduce fishing pressure and rebuild biomass. Benefits accumulated as more management measures were implemented.
Part I → Part II
You have read the evidence. Now become the pressure.
The field report ends where the teaching model begins. Its population, pressure and recovery values are normalised indices, designed to demonstrate relationships rather than forecast a real fishery.
Enter the ecosystem↓ILLUSTRATIVE TEACHING MODEL · NORMALISED INDICES · NOT A REAL STOCK FORECAST
Part II / An ecological experiment
THE LAST
CATCH
An ocean does not become empty overnight.
It disappears through decisions that each feel small.
01 — Extraction
YOUR CURSOR
IS NOW A NET.
Fish move in uneven migration streams.
Hold and drag to remove them.
02 — The decision
PRESSURE IS
A CHOICE REPEATED.
A click is easy to ignore. A sustained extraction is not.
Choose what happens next.
A short increase in catch has reduced both population and the system’s ability to replace what was removed.
03 — Bottom trawling
THE DAMAGE
OUTLIVES THE CATCH.
Hold and drag across the lower seabed.
Habitat scars remain after the vessel has passed.
04 — Global evidence
of assessed marine fish stocks are overfished
Capacity increases extraction.
Non-target life is removed too.
Recovery space is disturbed.
05 — After
THE OCEAN DID NOT
BECOME EMPTY AT ONCE.
IT DISAPPEARED
ONE CATCH AT A TIME.
Generated by this teaching model; not a measured fish-stock result.
Part III / After the catch
The simulation ends. The consequence would not.
A few minutes compressed extraction, bycatch and habitat disturbance into one screen. Real populations recover over biological time, and not every loss returns when fishing stops.
Pause before leaving ↓06 / Three questions
What changed when the catch became a decision?
Bycatch can include discarded fish, marine mammals, sea turtles, seabirds, corals and sponges. A catch is therefore also a decision about what the gear cannot perfectly select.
07 / Recovery is designed
No single button rebuilds a fishery.
Evidence from 288 assessed fisheries found cumulative benefits when management interventions were combined. Select the three interventions highlighted by the study; this is not a recovery probability.
Melnychuk et al., Nature Sustainability, 2021 ↗Build an evidence stack
0 / 3 MEASURESChoose measures to compare what each contributes. Outcomes remain fishery-specific.
08 / Before the next choice
A seafood label is the beginning of a question, not the end of one.
What exactly is being sold?
Where did it come from?
How was it caught?
What evidence supports the claim?
These questions do not make every purchase simple. They make hidden decisions more visible—and create a reason to demand traceable evidence.